Market Leading Development Tools—J-Link and J-Trace PRO
The J-Link debug probes with their outstanding performance, robustness, and ease of use are the market leading debug probes today. The J-Trace PRO sets a benchmark for instruction tracing with its streaming trace function that enables unlimited tracing at full clock speed.
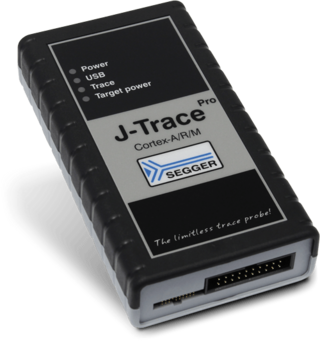
J-Trace PRO: The Leading Trace Solution
J-Trace PRO is an advanced debug probe that supports advanced tracing features of Arm Cortex and RISC-V cores.
Features
- Supports Streaming Trace (trace data is streamed to PC/debugger in real time, unlimited trace buffer)
- Has all the J-Link functionality
- Gigabit Ethernet interface
- SuperSpeed USB 3.0 interface (1.2 GBit/s)
- JTAG speed: 50 MHz
- Works with all currently available Cortex-M devices up to 150 MHz ETM trace clock (300 MHz CPU clock)
- Supports tracing on Cortex-M/R/A and RISC-V targets
- Free software updates
- 64 MB on-board trace buffer for legacy one-shot tracing mode
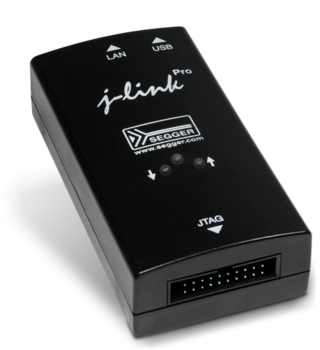
J-Link
SEGGER J-Links are the most widely used line of debug probes available today. They've proven their value for more than 10 years.
Features
- Ultrafast download speed
- Unlimited breakpoints in flash memory
- Real-Time Transfer technology for extended debug information
- All popular devices are supported (Arm, RISC-V, 8051, PIC32, RX)
- All popular debuggers are supported
- Multi-platform support (Windows, Linux, Mac)
- Free updates
Supported devices
SEGGER Debug and Trace Probes support a wide range of CPUs and architectures.
The list is always valid for the latest version (highest version number) of the software. This may be a release (even version number) or a beta version (odd version number) since support for some devices is usually added in a beta phase first.
Note that a device may still be supported even if it is not on the list. Device not listed? Please don’t hesitate to contact us.
Debug & Trace Probes family: A comparison
| Feature | J-Link EDU | J-Link EDU Mini | J-Link BASE Classic | J-Link BASE Compact | J-Link PLUS Classic | J-Link PLUS Compact | J-Link WiFi | J-Link ULTRA+ | J-Link PRO | J-Trace PRO Cortex-M | J-Trace PRO Cortex | J-Trace PRO RISC-V |
|---|---|---|---|---|---|---|---|---|---|---|---|---|
| Download speed into RAM1 | 1.0 MB/s | 200 KB/s | 1.0 MB/s | 1.0 MB/s | 1.0 MB/s | 1.0 MB/s | 1.0 MB/s | 4.0 MB/s | 4.0 MB/s | 4.0 MB/s | 4.0 MB/s | 4.0 MB/s |
| Max. target interface speed | 15 MHz | 4 MHz | 15 MHz | 15 MHz | 15 MHz | 15 MHz | 15 MHz | 50 MHz | 50 MHz | 50 MHz | 50 MHz | 50 MHz |
| Max. SPI interface speed | 12 MHz | 4 MHz | 12 MHz | 12 MHz | 12 MHz | 12 MHz | 12 MHz | 50 MHz | 50 MHz | 50 MHz | 50 MHz | 50 MHz |
| Max. SWO speed | 30 MHz | 4 MHz | 30 MHz | 30 MHz | 30 MHz | 30 MHz | 30 MHz | 100 MHz | 100 MHz | 100 MHz | 100 MHz | 100 MHz |
| High Speed Sampling Bandwidth | 1 kHz5 | 1 kHz5 | 1 kHz5 | 1 kHz5 | 1 kHz5 | 1 kHz5 | 1 kHz5 | Unlimited6 | Unlimited6 | Unlimited6 | Unlimited6 | Unlimited6 |
| Supported target voltage | 1.2V - 5V | 3.3V | 1.2V - 5V | 1.2V - 5V | 1.2V - 5V | 1.2V - 5V | 1.2V - 5V | 1.2V - 5V | 1.2V - 5V | 1.2V - 5V | 1.2V - 5V | 1.2V - 5V |
| USB | ||||||||||||
| Ethernet | ||||||||||||
| WiFi | ||||||||||||
| JTAG interface | ||||||||||||
| cJTAG interface | ||||||||||||
| SWD interface | ||||||||||||
| SWO interface | ||||||||||||
| Microchip ICSP® interface | ||||||||||||
| Renesas FINE interface | ||||||||||||
| ETM Trace | ||||||||||||
| ETB/MTB Trace | ||||||||||||
| Unlimited Streaming Trace + Live Analysis4 |
Supported
Not supported
1 The download speeds listed here are the peak download speeds that can be achieved by the particular J-Link model. The actual download speed may be lower as it depends on various factors, such as, but not limited to: The selected debug interface & speed, the CPU core and its operating frequency, other devices in the JTAG chain in case JTAG is used as target interface.
4 Unlimited streaming trace allows to transmit trace in real-time to the PC . While traditional trace only allows to see and analyze the last xxx MB of trace data, with streaming trace it is possible to have all data available. This allows extended debugging features like code coverage, CPU load analysis based on a function basis, ...
5 Max. sampling frequency is guaranteed for sampling one variable and for appropriate target interface speeds being selected (min. 1 MHz). Sampling more than one variable in parallel, may lead to a smaller max. sampling frequency. When this threshold of sampling frequency decrease is hit, depends on different factors (Number of variables to be sampled in parallel, size of each variable, selected target interface speed, ...)
6 Only limited by the bandwidth of the debug interface. Typical sampling frequency of one variable: > 10 kHz.

